
Circumpolar Arctic Vegetation Mapping Project
Abstract
The Circumpolar Arctic Vegetation Map (CAVM) project was an international effort to map the vegetation and associated characteristics of the circumpolar region, using a false color infrared image created from AVHRR satellite data as the base map. A composite image was created by selecting pixels of maximum reflectance from 1993 and 1995 data. Mapping efforts in Canada, Norway, Greenland, Russia, Iceland and the United States used uniform methods to integrate information on bioclimatic zones, bedrock, surficial geology, acidity of parent material, soils, hydrology, remotely-sensed vegetation classification, Normalized Difference of Vegetation Index (NDVI), previous vegetation studies, and the regional expertise of the mapping scientists.
Maps of vegetation complexes and plant biomass are examples of the derived products that can be created from the CAVM database, linking biophysical attributes with the dominant vegetation type. Lookup tables created in ARCINFO link the biophysial attributes and allow the mapping and determination of the areal extent of each attribute category.
The CAVM shows the types of vegetation that occur across the Arctic, between the ice-covered Arctic Ocean to the north and the northern limit of forests to the south. Environmental and climatic conditions are extreme, with a short growing season and low summer temperatures. The region support plants such as dwarf shrubs, herbs, lichens and mosses, which grow close to the ground. As one moves southward (outward from map's center in all directions), the amount of warmth available for plant growth increases considerably, allowing the size, abundance, and variety of plants to increase as well. Climate and other environmental controls, such as landscape, topography, soil chemistry, soil moisture, and the available plants that historically colonized an area, also influence the distribution of plant communities.
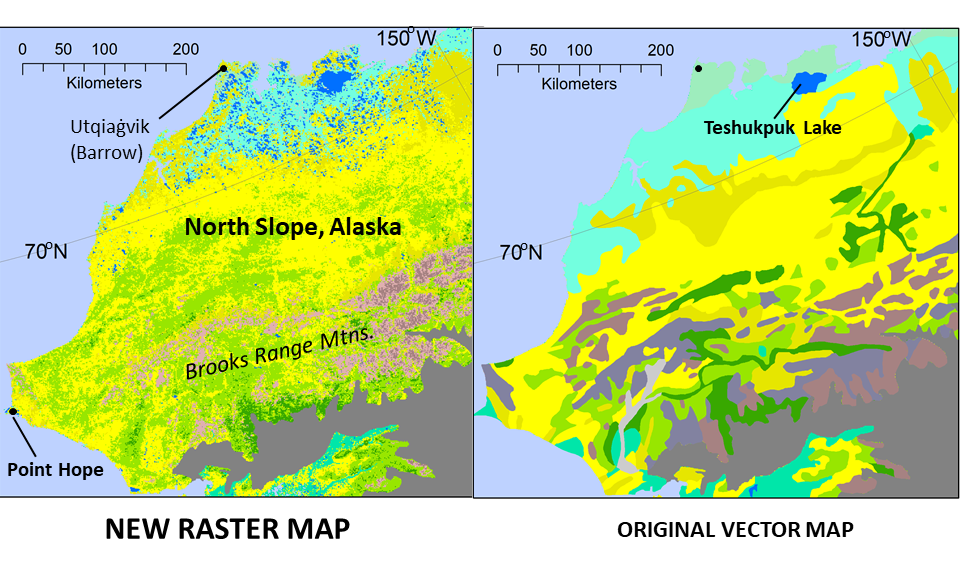
The original CAVM (CAVM Team 2003, Walker et al. 2005) was the first vegetation map that covered the entire Arctic using a single, unified legend. It has been widely used as a base map for studies in the Arctic and was the framework for terrestrial vegetation sections of the AMAP Arctic Biodiversity Assessment (CAFF 2013) and many other applications. However, the vector-format of the original map was not compatible with many raster-format data sets.
To meet the need for a raster version of the map, we built on the strengths of the original CAVM to create a map with 1-km spatial resolution pixels and improved mapping (Raynolds et al. 2019). The Raster CAVM uses the legend, extent, and projection of the original CAVM. The front side of the map portrays the dominant vegetation in each 1-km pixel. The legend contains 16 briefly described vegetation units. The back side of the map provides expanded descriptions of each vegetation unit, representative vegetation units (according to the Braun-Blanquet classification approach), color photographs of typical landscapes and characteristic plant species, details of the mapping methods, and supporting ancillary maps (MODIS-based NDVI base map, bioclimate subzones, floristic provinces, elevation, and aboveground plant biomass).
The Raster CAVM is based on a classification of eighteen geographic/floristic sub-sections of the Arctic, using AVHRR and MODIS (red and infrared reflectance, and NDVI) and elevation data (ESRI 1993). The classification units were compared with ancillary data layers to assign each unit to a preliminary CAVM vegetation unit. Regional vegetation maps were the most important resources for this step. Climate data, including locally available ground data and interpolated data, were also important. Ground studies and vegetation descriptions were consulted for all sections of the map. High-resolution imagery and ground photos hosted on Google Earth were especially helpful for areas with limited ground data. Geology maps were used to differentiate between acidic and nonacidic mountain units. Elevation data were used to identify areas over 1,000 m elevation, where adiabatic cooling would result in a significantly cooler climate than at sea level, resulting in a different bioclimate elevation belts and different vegetation than the surrounding areas at lower elevations. Each portion of the draft Raster CAVM was sent to international colleagues with regional vegetation expertise. The input from these reviewers was used to improve the map and the legend description of plant communities included in each mapping unit.